 Revolutionizing · Modernizing · SimplifyingRevolutionizing · Modernizing · Simplifying
There are 69 condos on the market in Estes Park right now, at a median asking price of $500,000, ranging from $215,000 to $2,650,000.
Over six months of supply means there are more homes for sale than the current pace of sales absorbs. Buyers have choice and time, and sellers usually have to compete on price or condition.
There are 69 for sale and 102 sold in the last twelve complete months, which is 8.1 months of supply. Those that sold went for a median of 98% of their asking price after a median 74 days on the market.
| Month | Homes sold | Median sold price | |
|---|---|---|---|
| Sep 2025 | 13 | $482,250 | |
| Oct 2025 | 8 | $519,000 | |
| Nov 2025 | 10 | $640,000 | |
| Dec 2025 | 9 | $435,000 | |
| Jan 2026 | 5 | $610,000 | |
| Feb 2026 | 2 | $632,500 | |
| Mar 2026 | 6 | $622,000 | |
| Apr 2026 | 10 | $527,500 | |
| May 2026 | 14 | $610,000 | |
| Jun 2026 | 13 | $430,000 | |
| Jul 2026 | 7 | $540,000 | |
| Aug 2026 | 5 | $625,000 |
| Bedrooms | For sale | Median asking price |
|---|---|---|
| 1 bedroom | 12 | $319,500 |
| 2 bedrooms | 29 | $389,000 |
| 3 bedrooms | 25 | $639,000 |
| 4 bedrooms | 1 | $869,500 |
| 5 or more | 1 | $2,650,000 |
| Price | For sale | Share | |
|---|---|---|---|
| Under $300k | 12 | 17% | |
| $300k to $500k | 22 | 32% | |
| $500k to $750k | 26 | 38% | |
| $750k to $1M | 8 | 12% | |
| $1.5M and up | 1 | 1% |
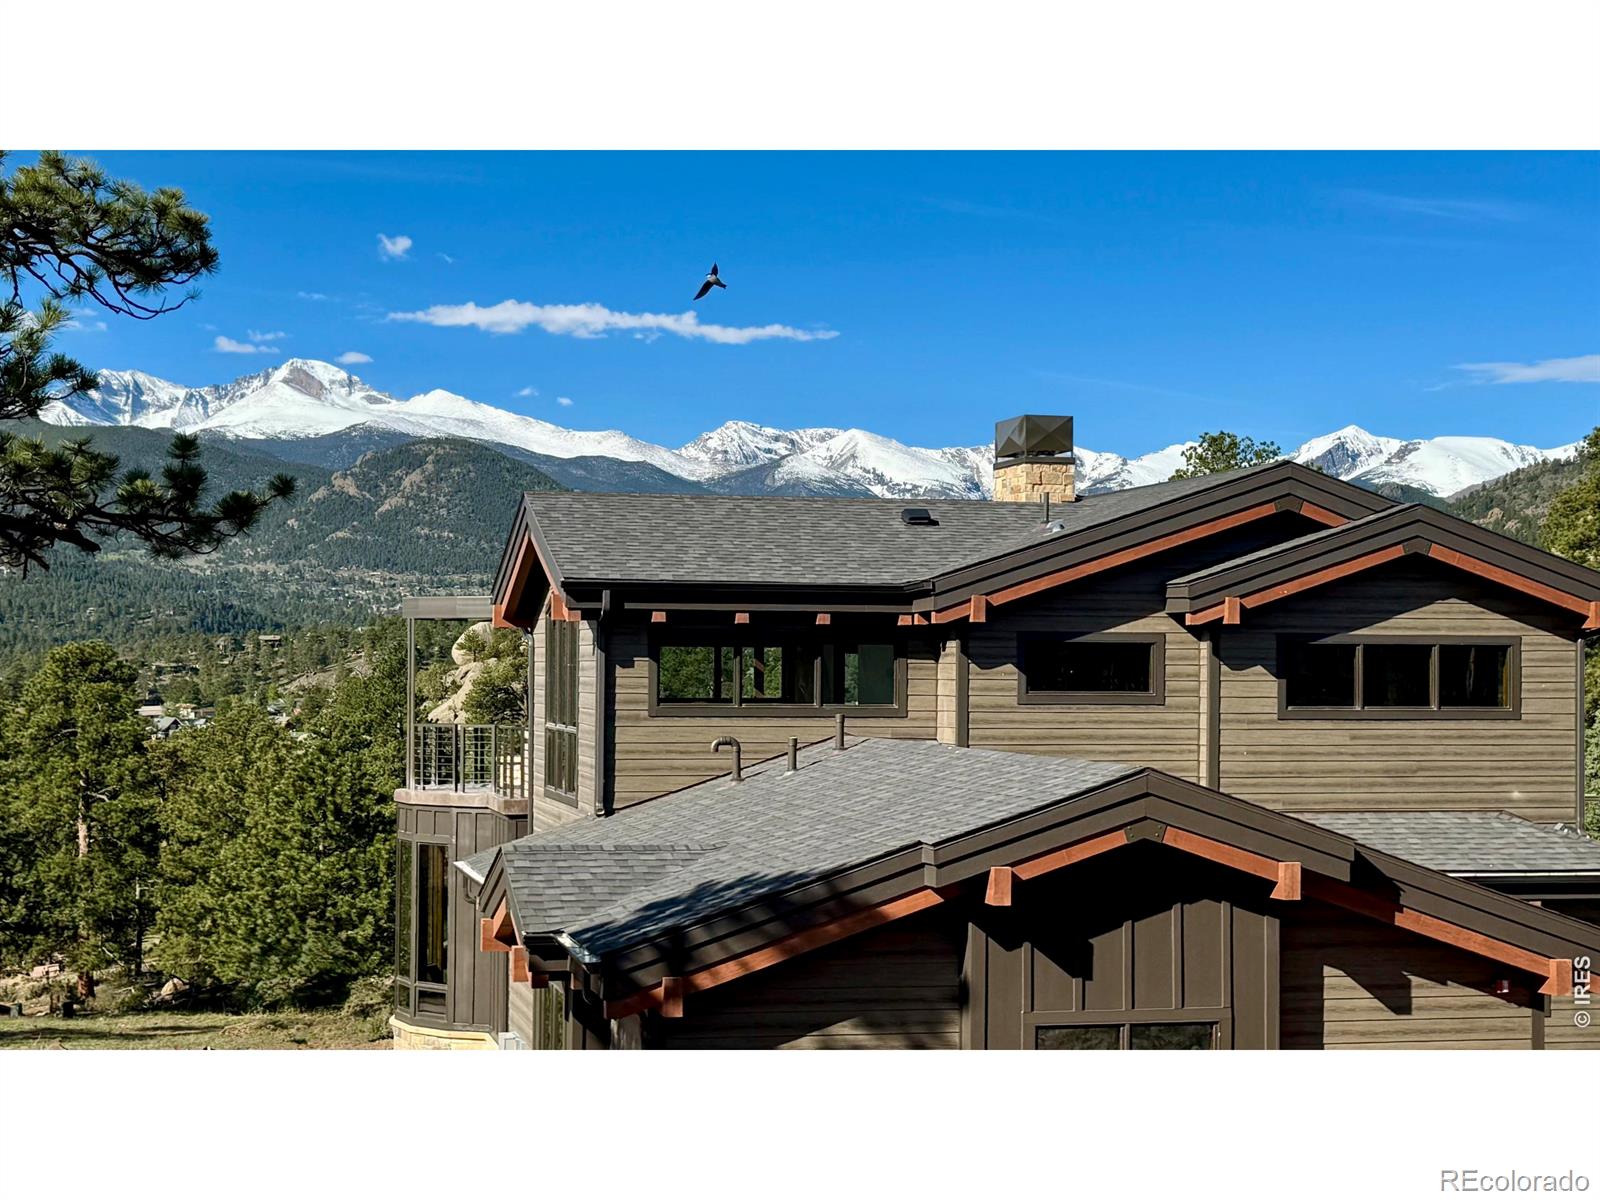
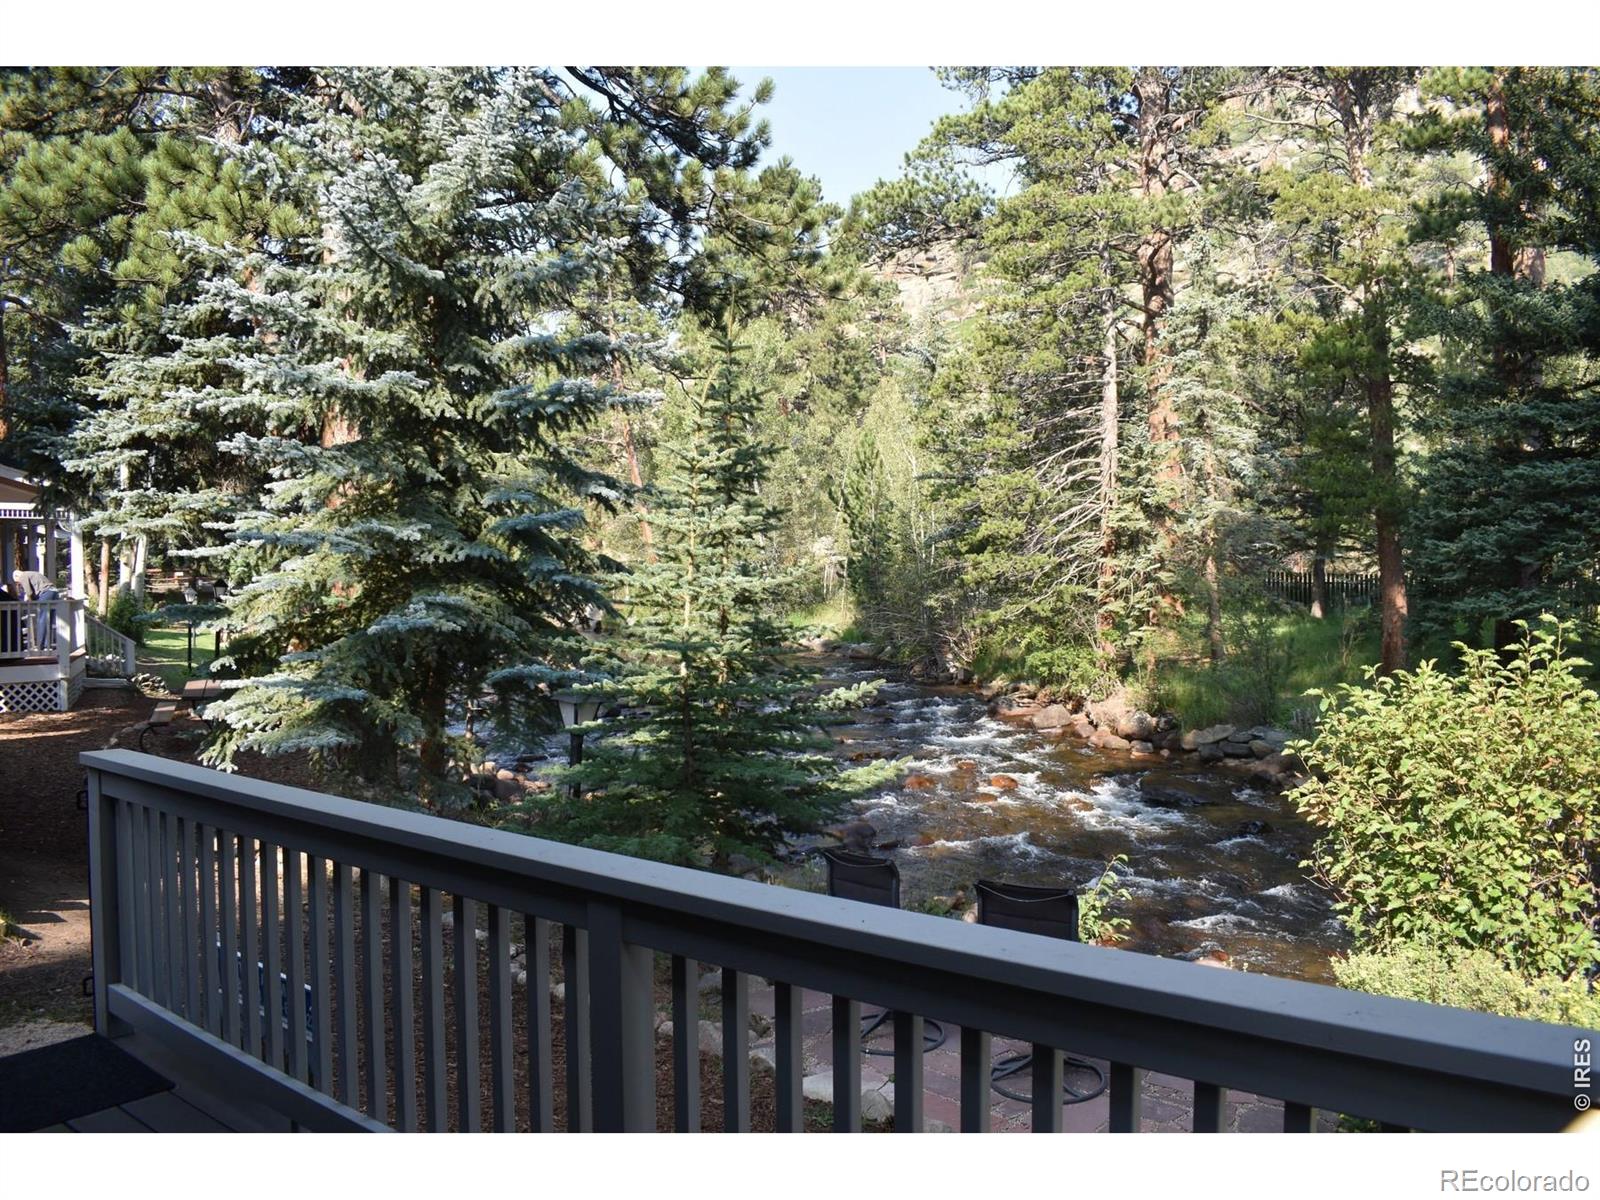
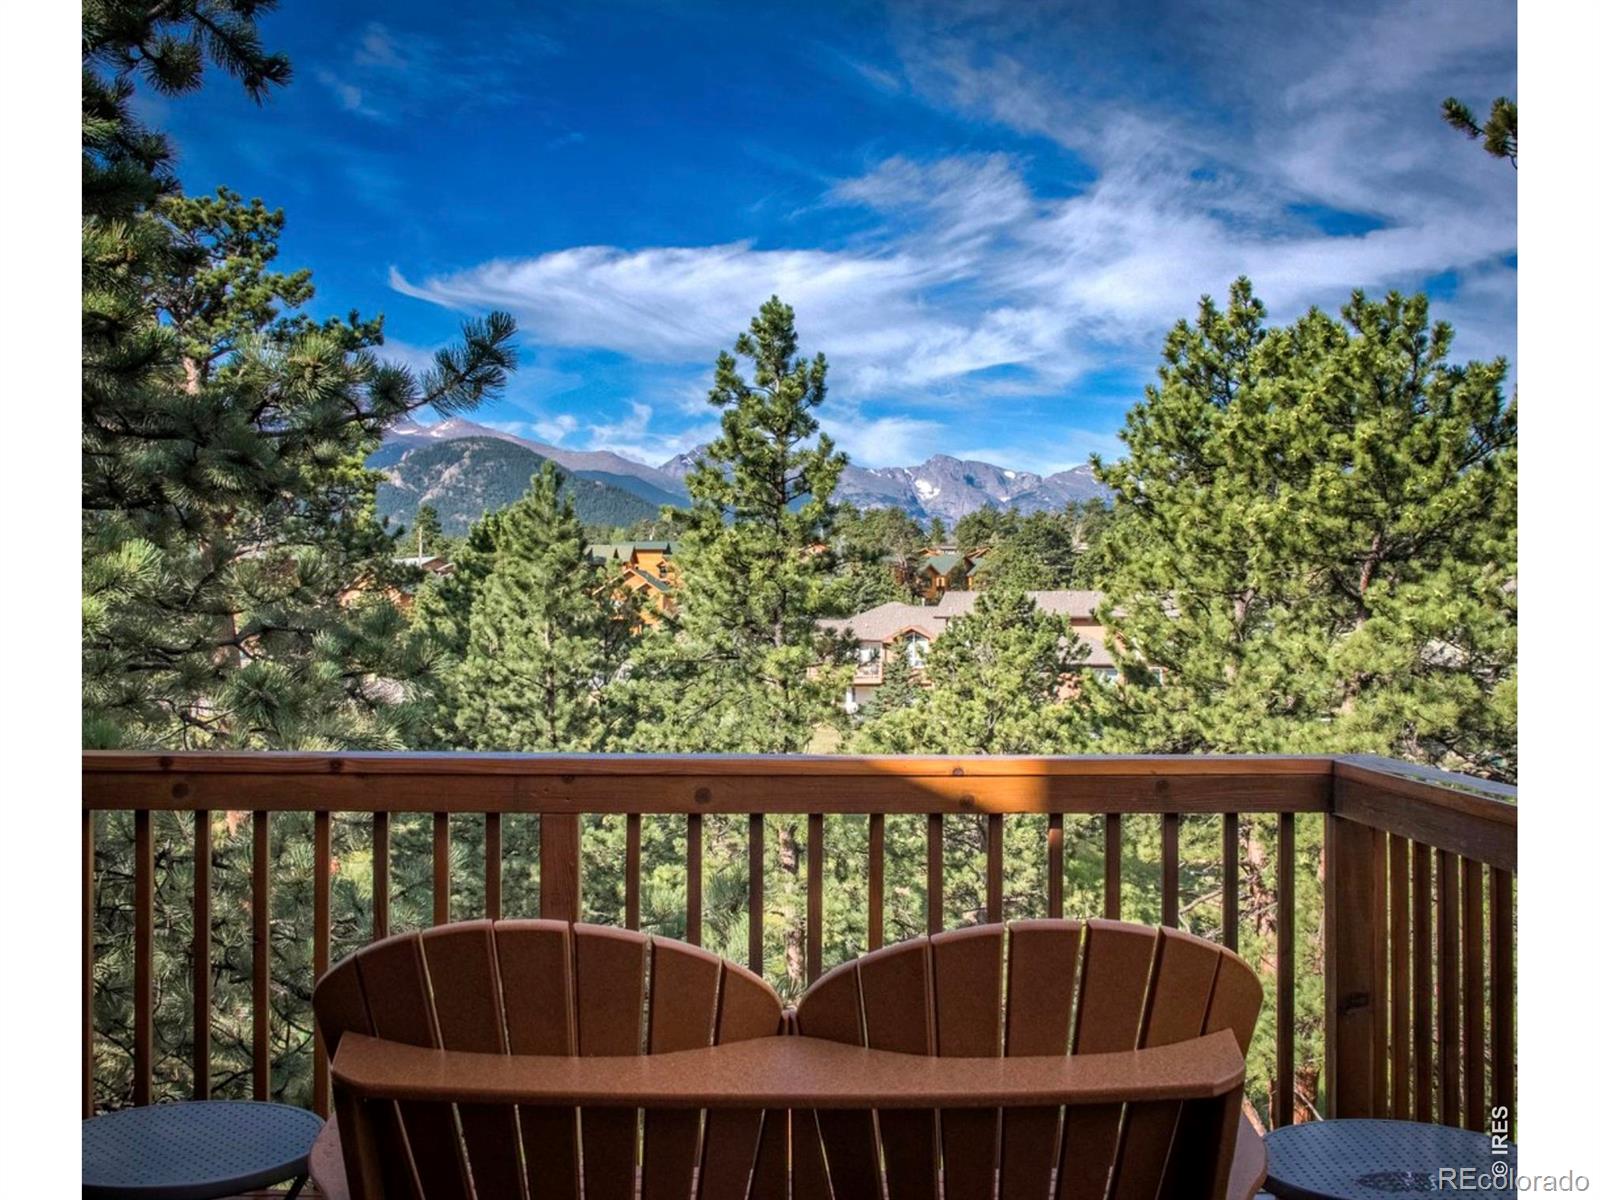
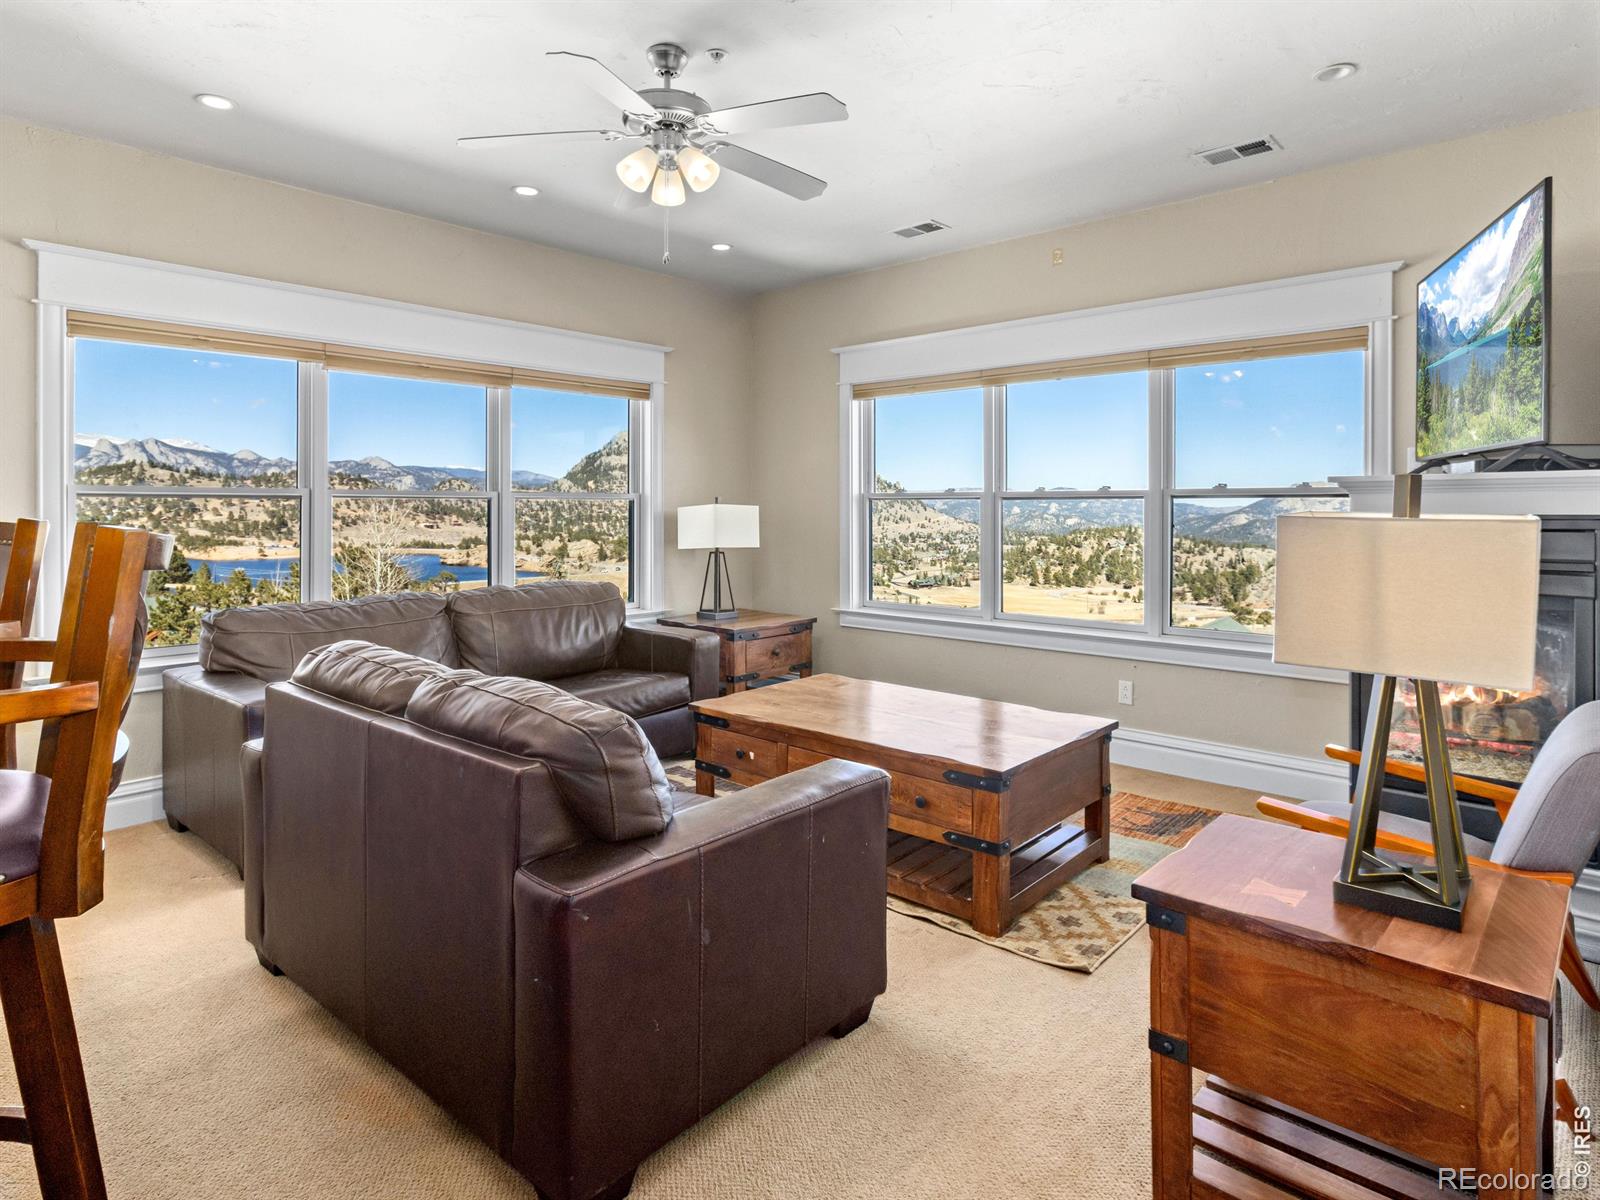
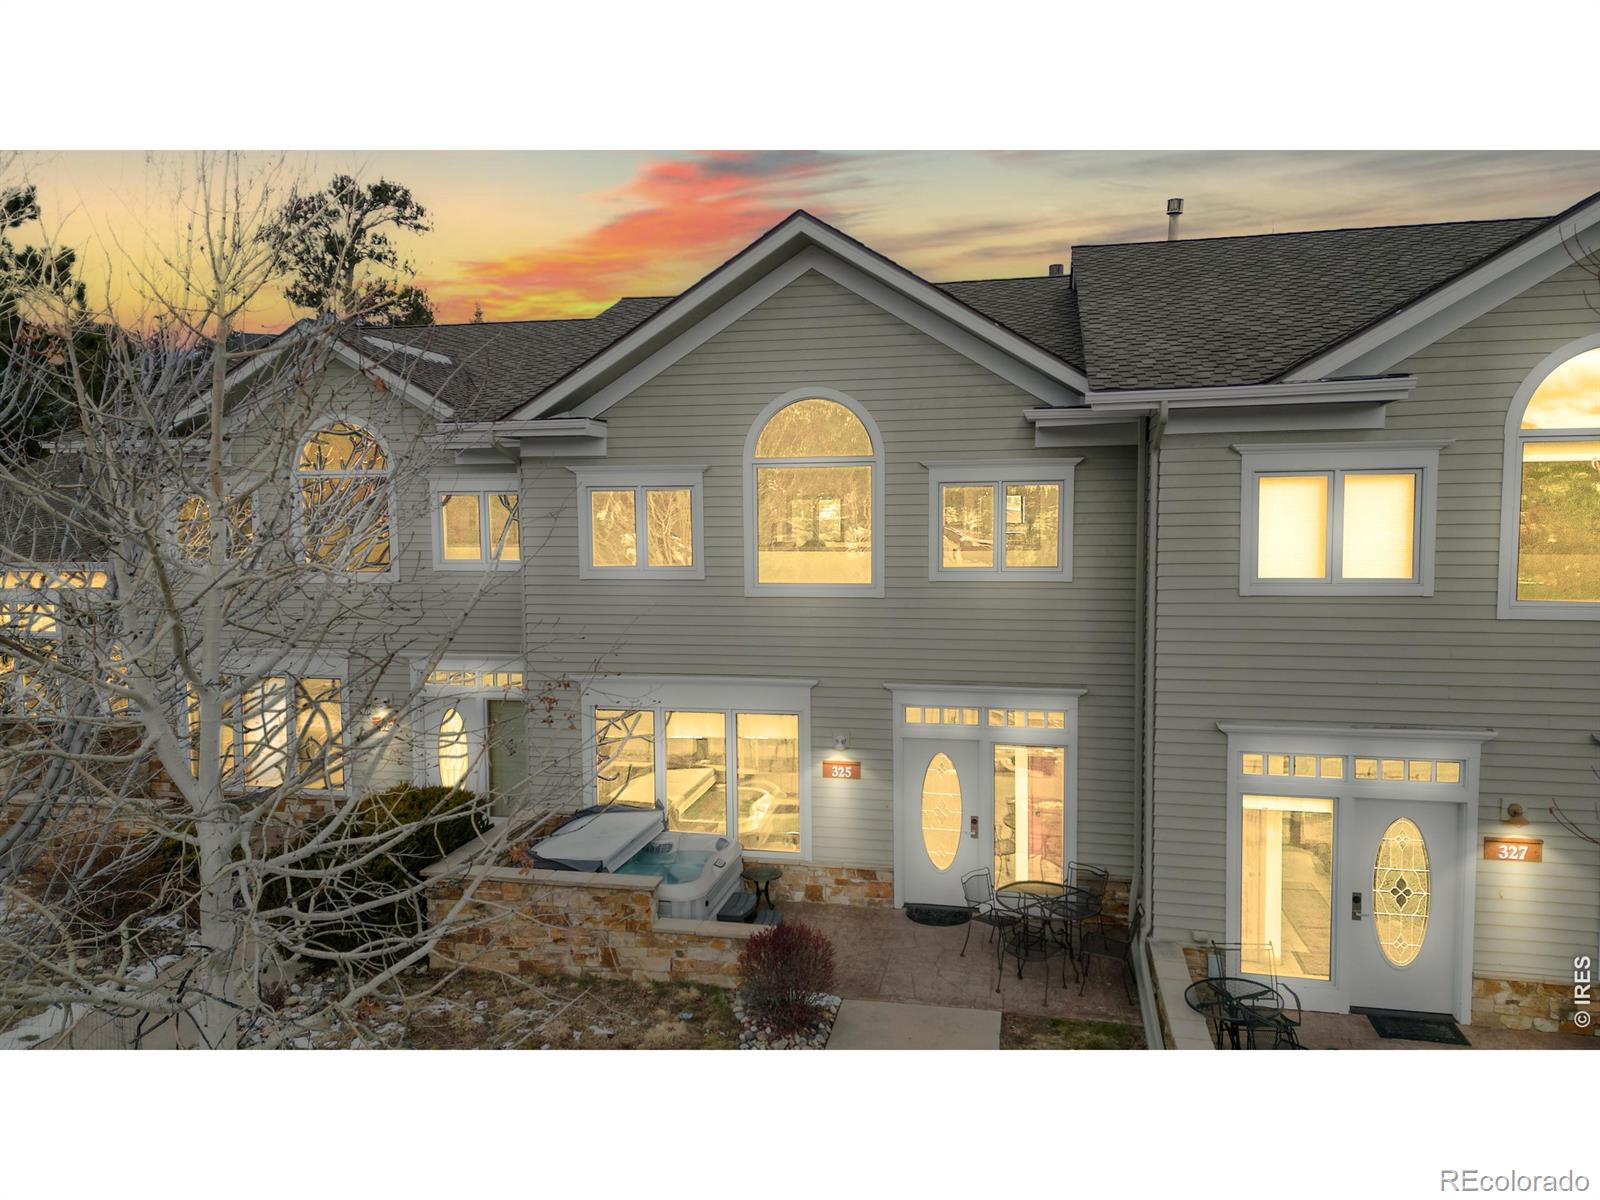
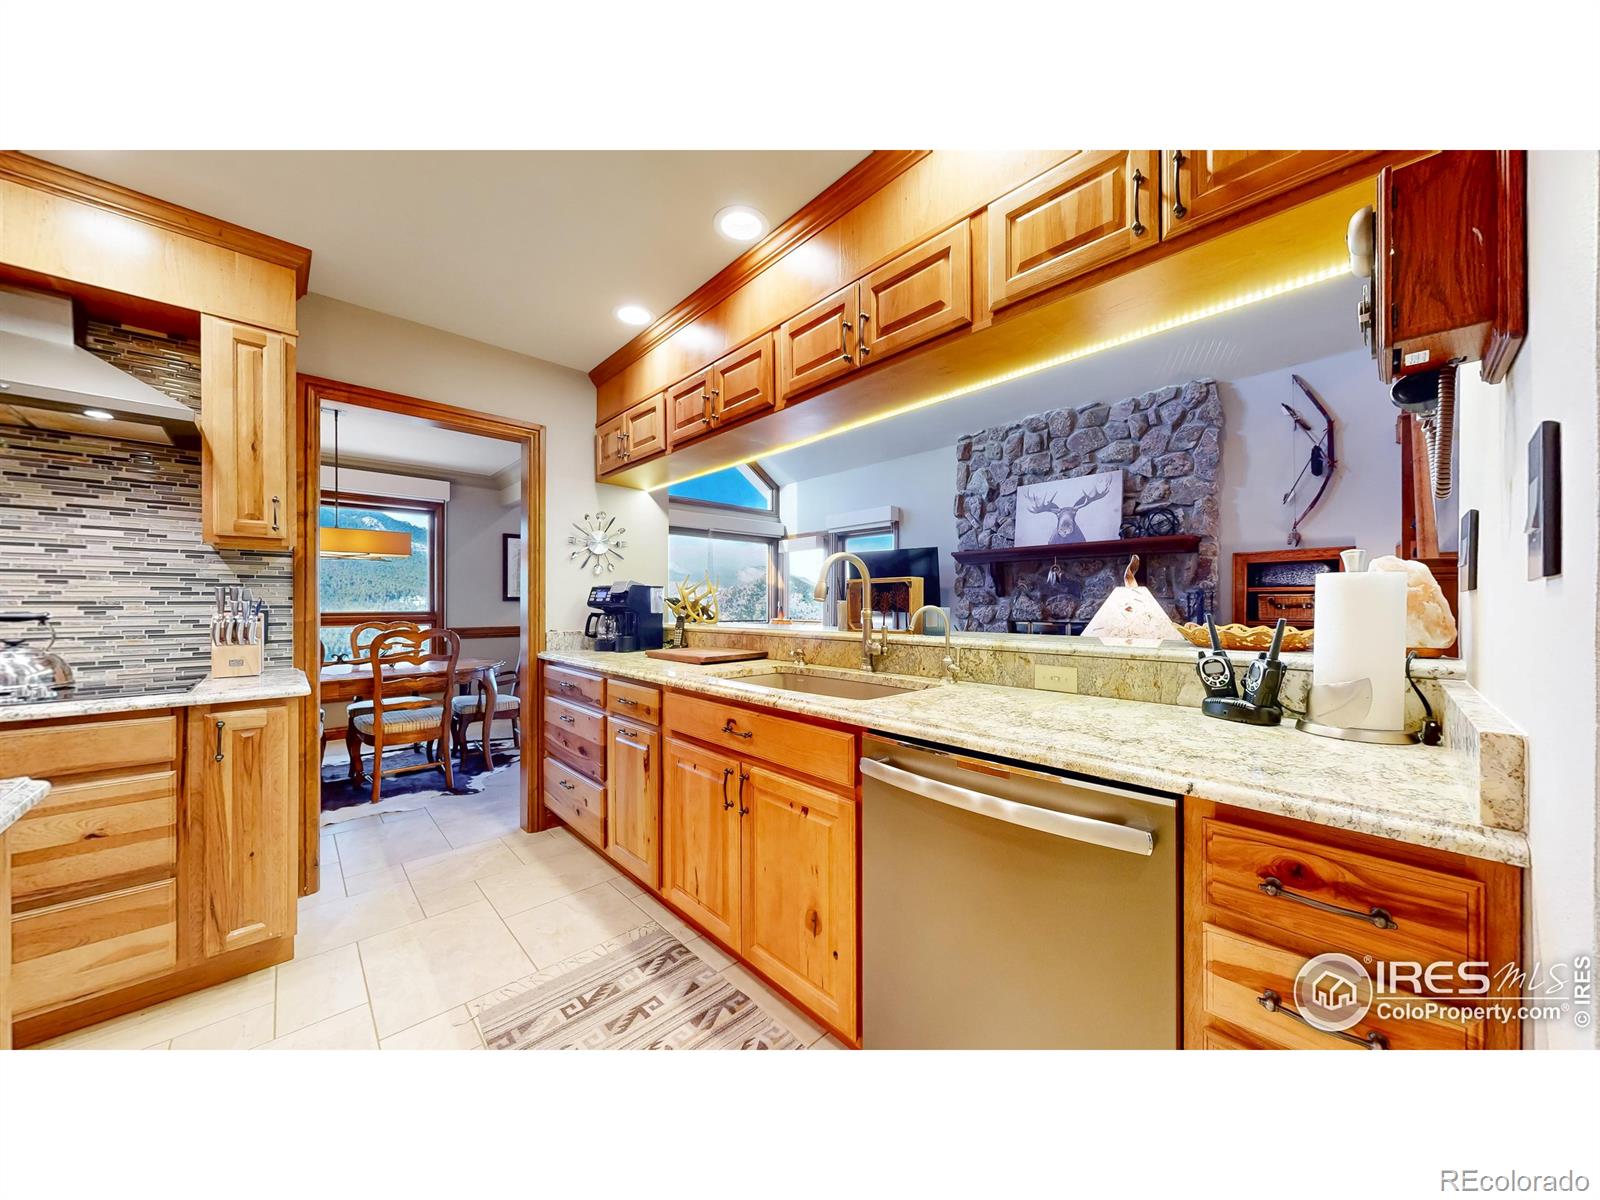
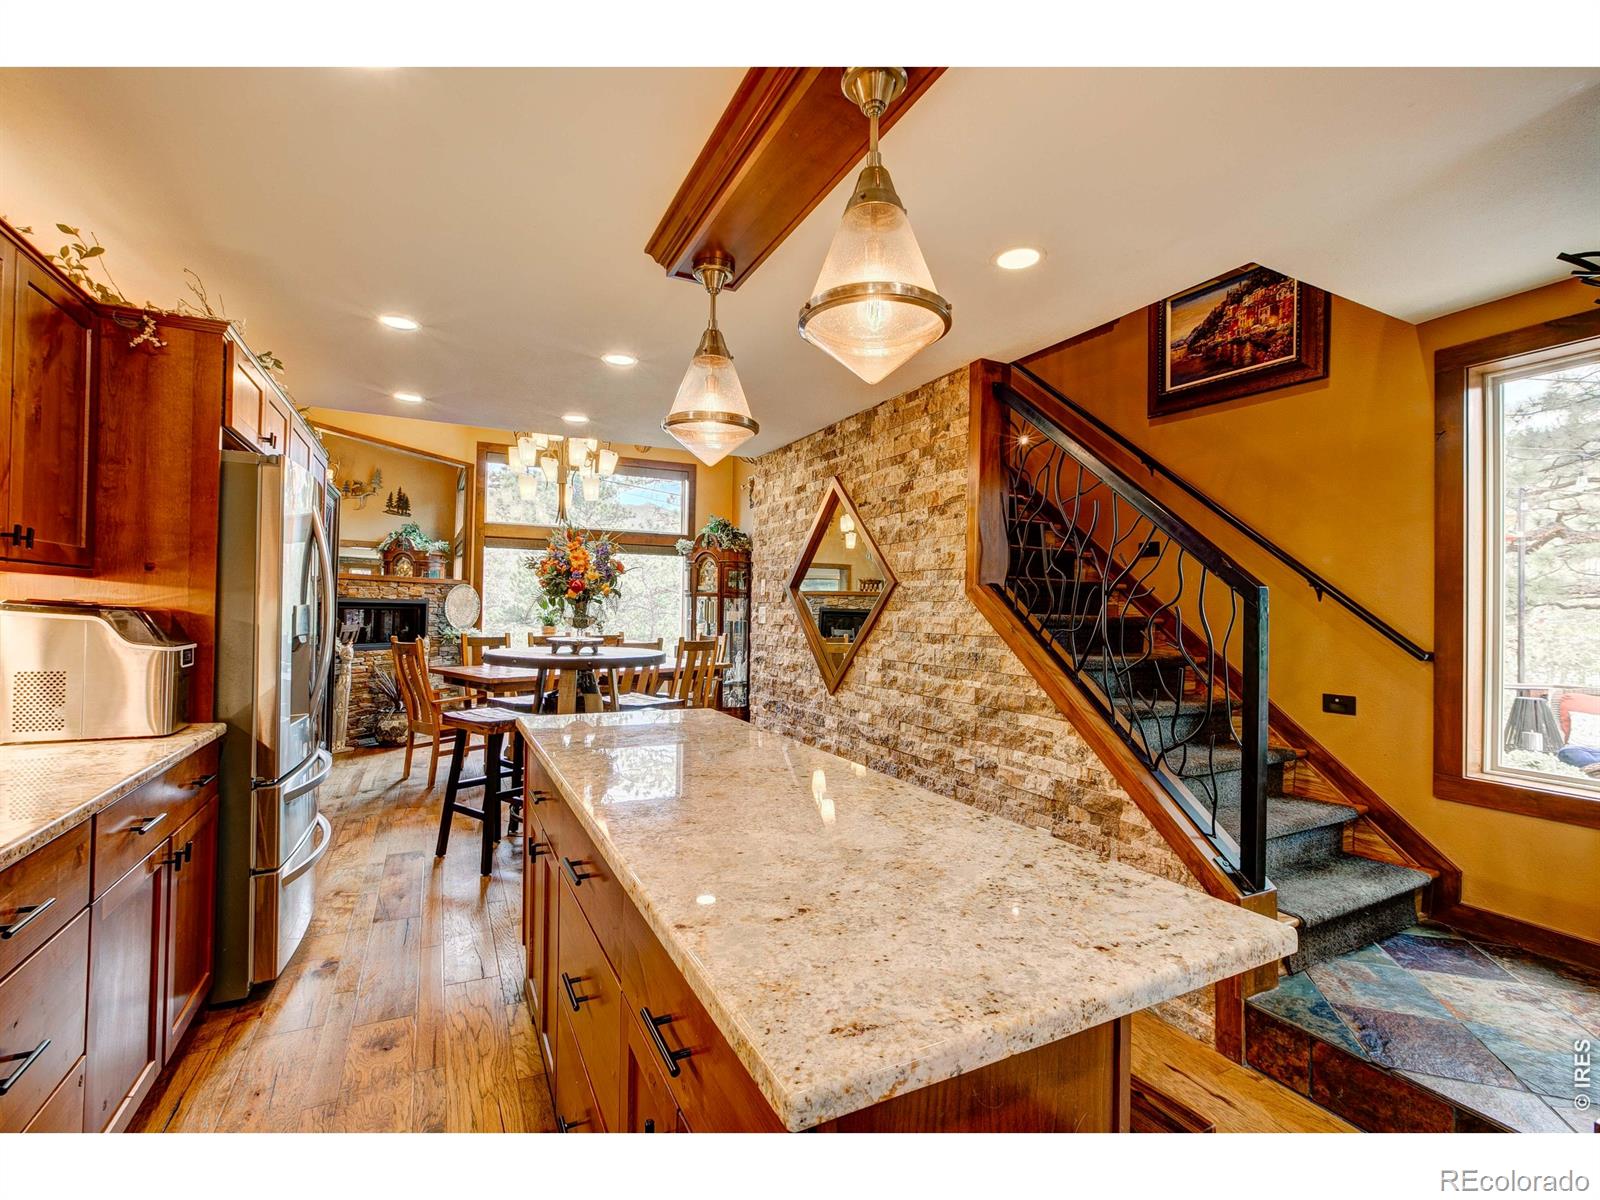
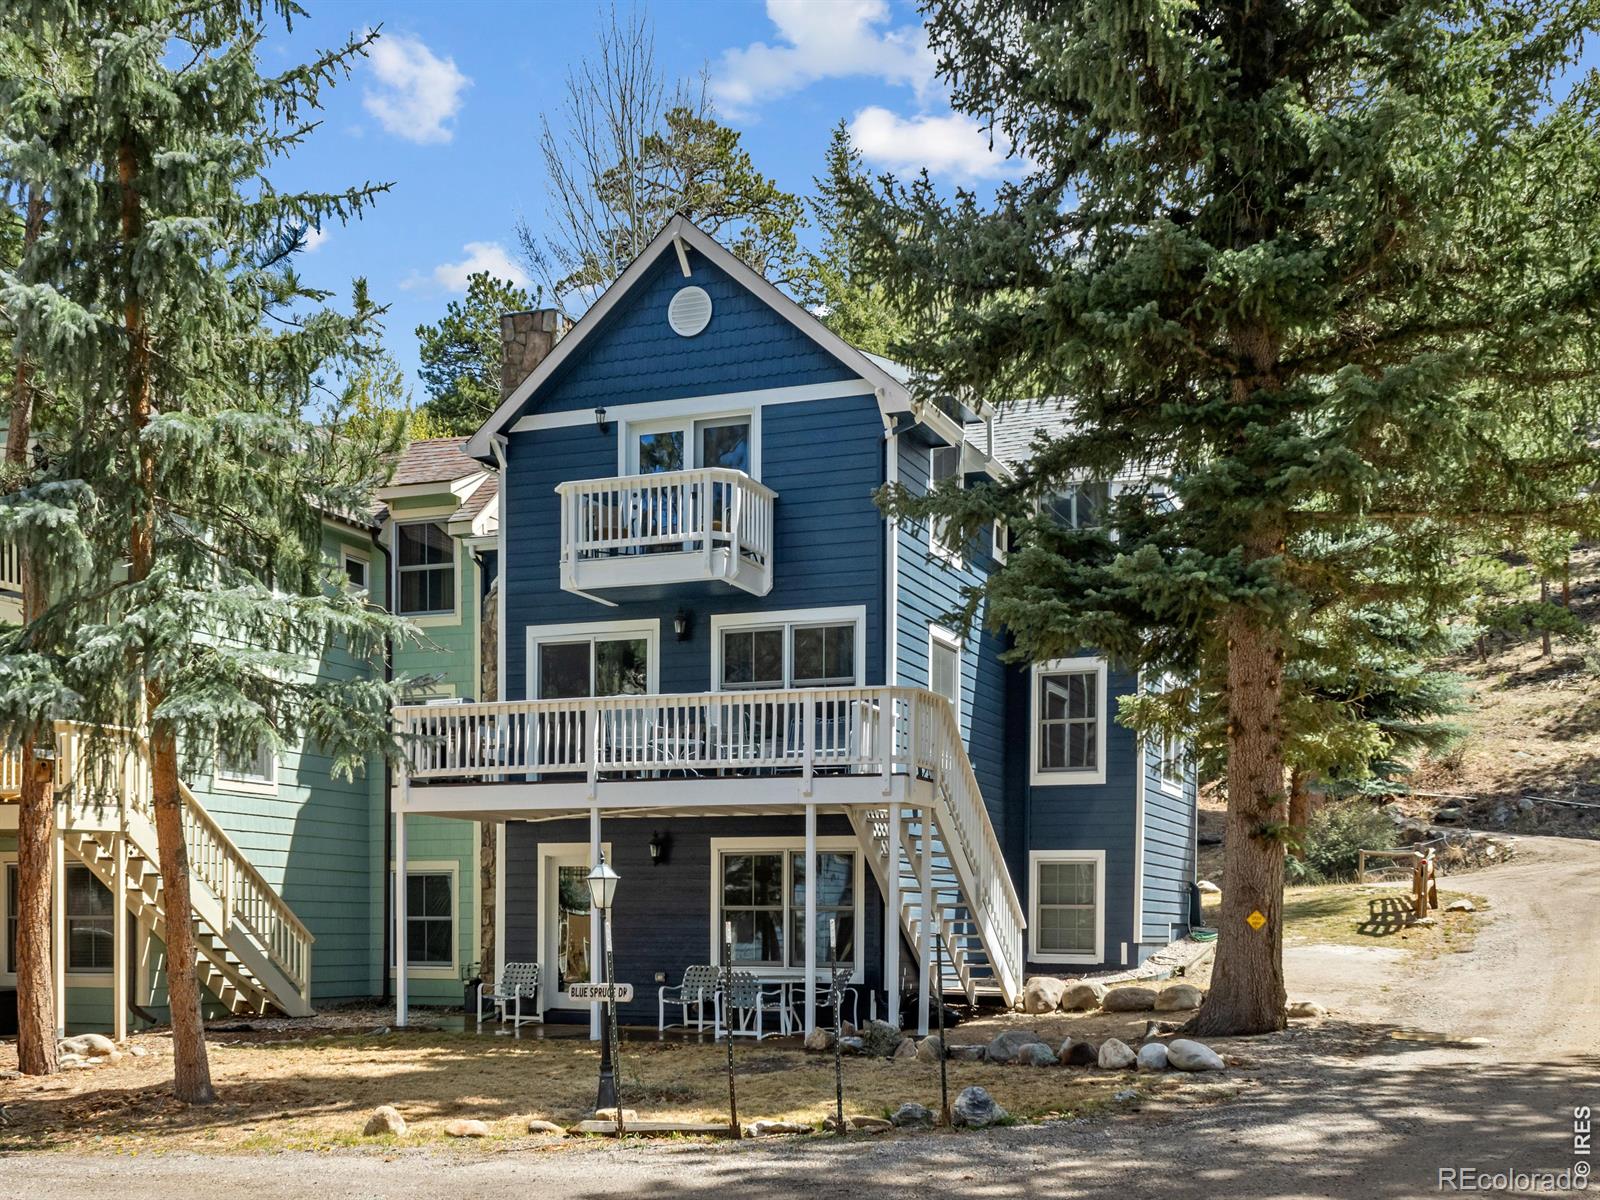
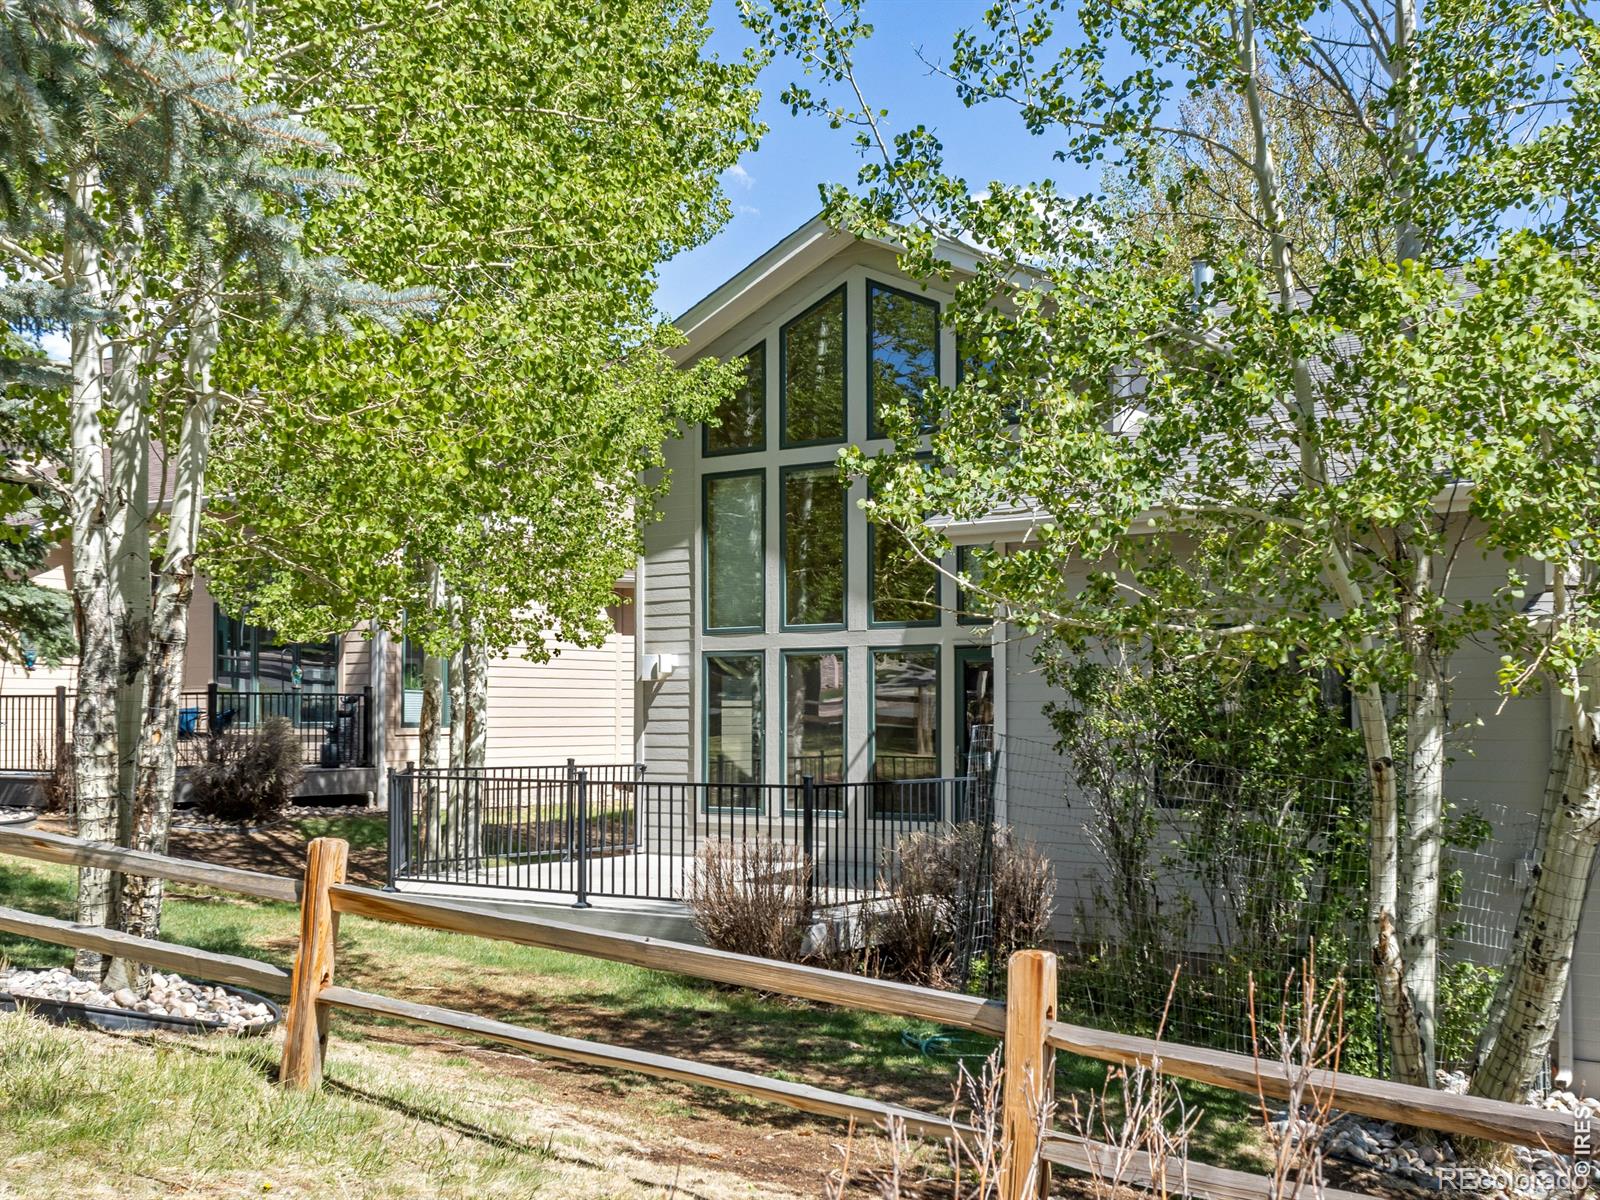
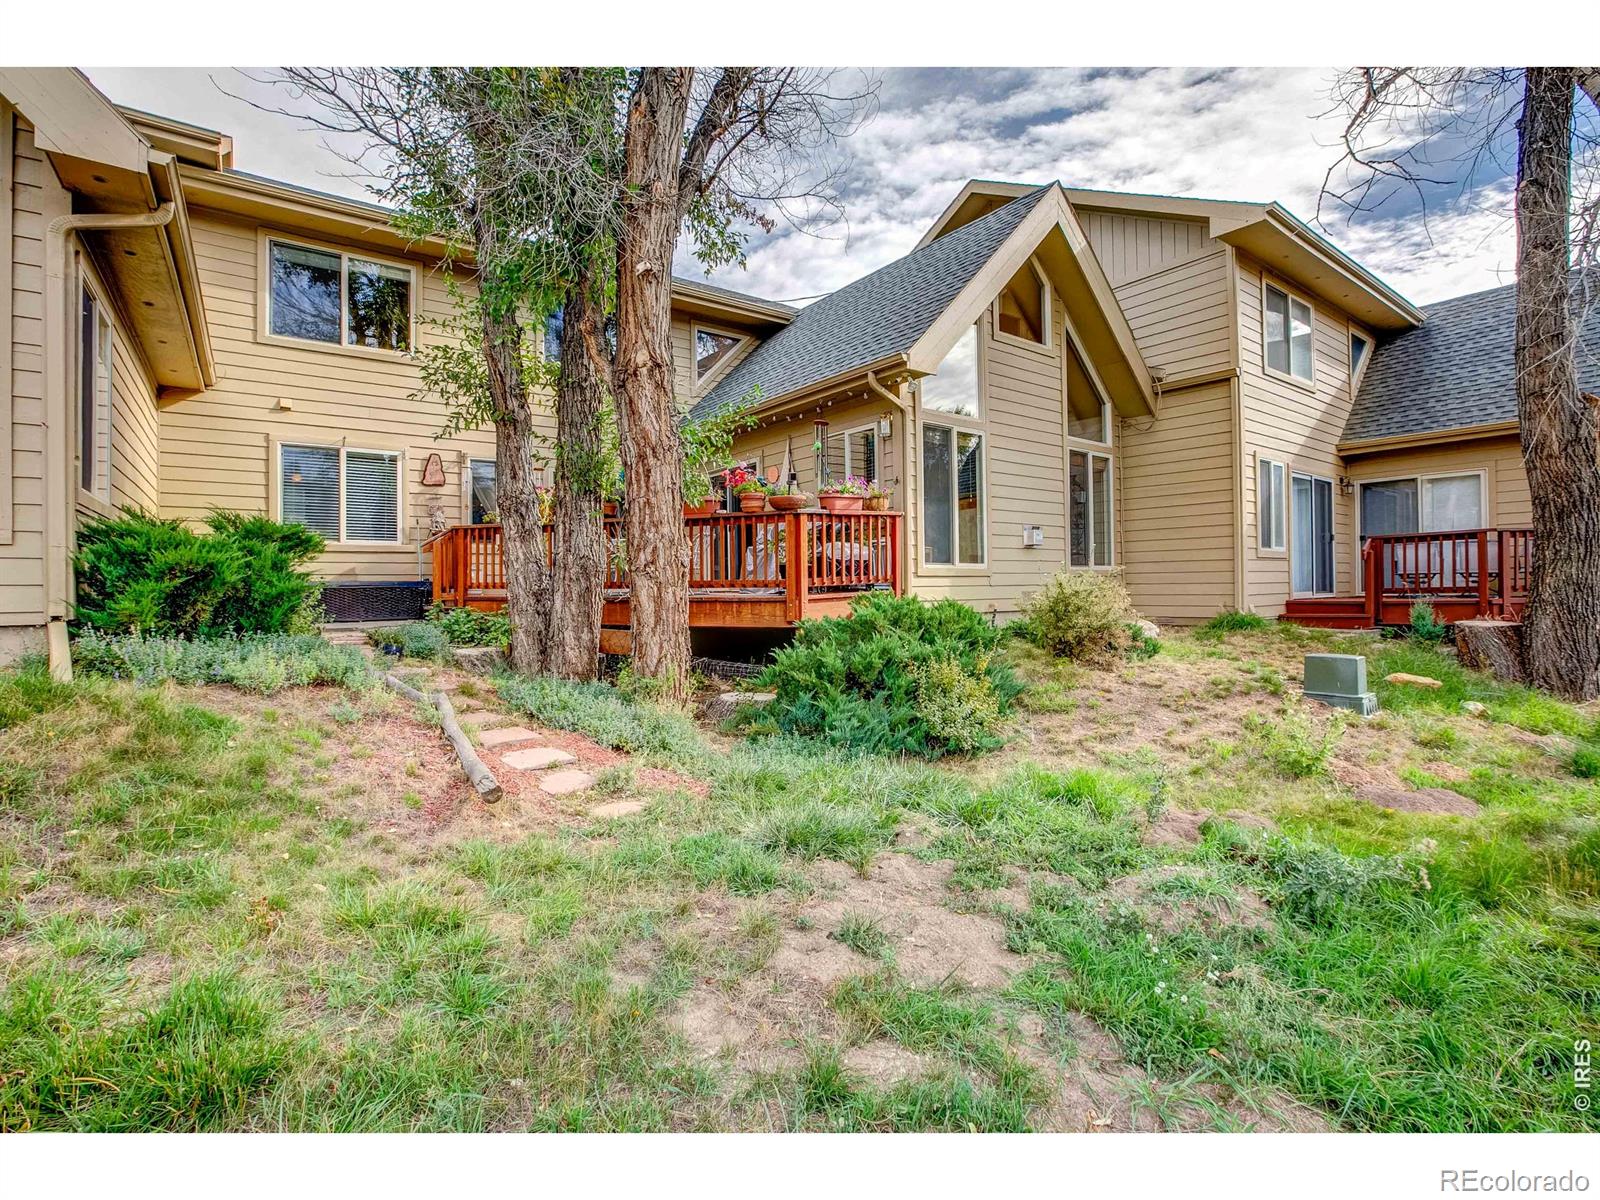
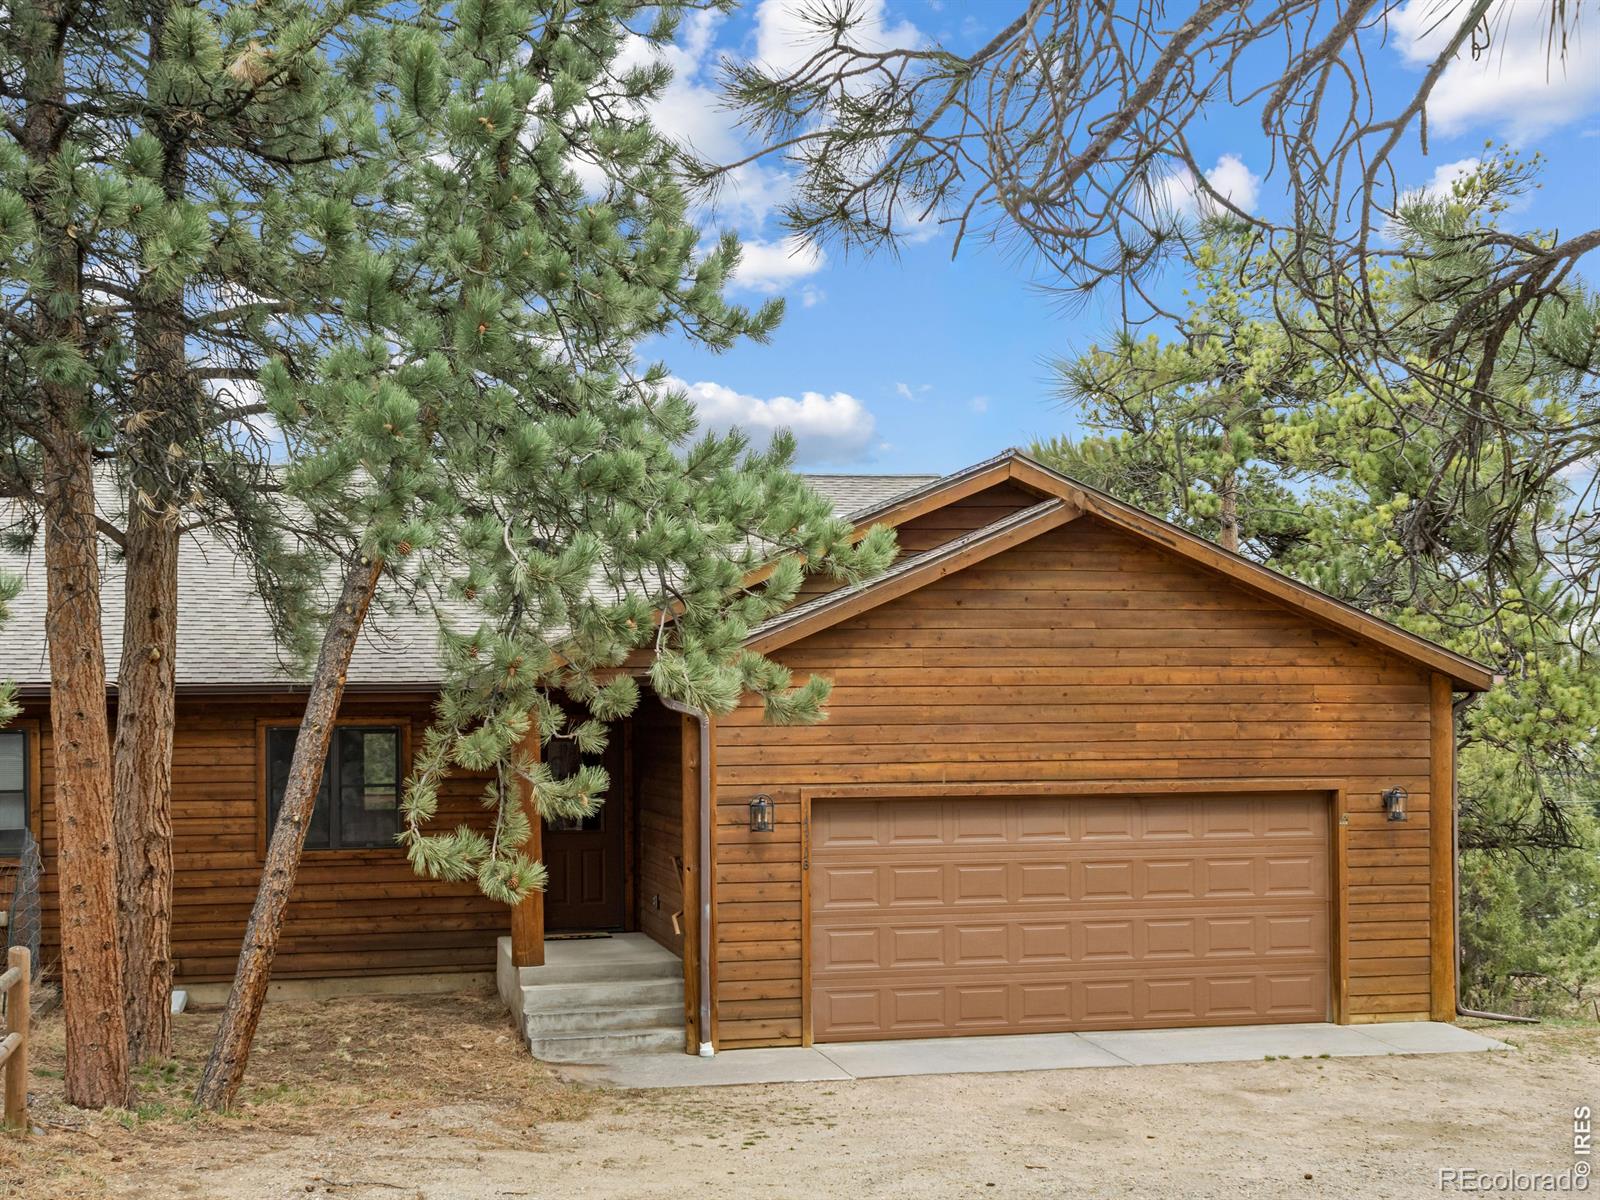
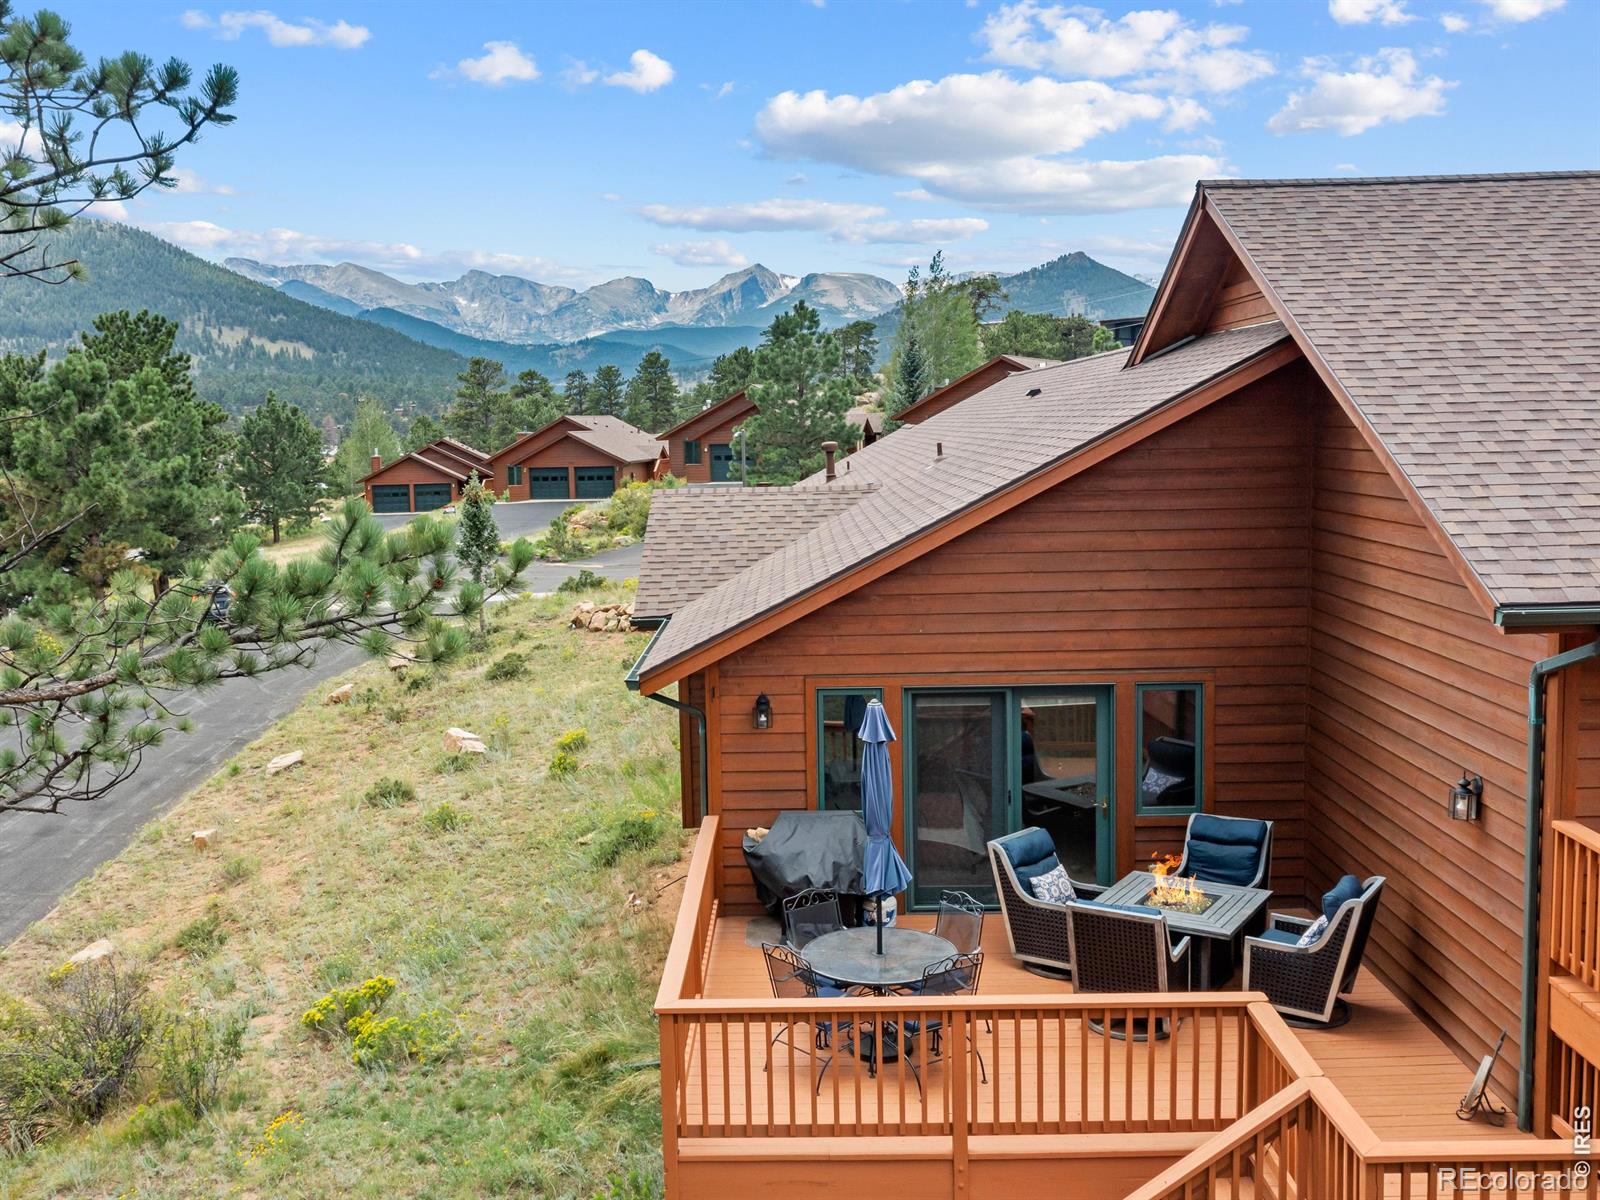
See every home for sale on the map
There are 69 condos for sale in Estes Park, CO as this page loaded, 13 of which came on the market in the last 30 days.
The median asking price is $500,000, or about $386 per square foot. Asking prices run from $215,000 to $2,650,000.
102 sold over the last twelve complete calendar months at a median sold price of $533,500, a median 98% of the asking price, taking a median 74 days from listing to closing.
The median condos currently for sale in Estes Park has been listed for 81 days.
Condos in Estes Park are a buyer's market - 8.1 months of supply. Under three months is a seller's market, three to six is balanced, and over six is a buyer's market.
Every number on this page is recalculated from the live MLS feed at the moment the page loads - it is not a saved search or a monthly snapshot. Figures cover residential homes for sale; rentals, land and commercial are excluded, as are fractional co-ownership shares, which are priced per share and would distort the medians. Sold figures cover the last twelve complete calendar months. Market data is deemed reliable but not guaranteed - talk to us before making a decision on it.